Fall fertilizer considerations in 2019
Written by Emerson Nafziger, University of Illinois (View the U of I bulletin)
The high number of prevented-planting fields in some areas, the late start to harvest, and the inability to apply P and K fertilizer as planned last fall or this past spring combine to raise a number of questions about fall application of P, K, and lime over the next few months.
Prevented-planting fields
If P and K fertilizers were applied last fall or this past spring but no crop could be planted, there’s no reason not to count all of the applied P and K as available for the 2020 crop. The same goes for any lime applied over the past 12 months. Any nitrogen (N) that was applied with MAP or DAP is likely no longer available, and shouldn’t be counted in the 2020 supply.
If the plan was to sample soil last fall or this spring to determine how much P, K, and lime to apply but that didn’t get done, these fields can be sampled now in preparation for fall or spring application. If the plan was to sample after the 2020 crop, there’s no reason to move that up to this fall; these nutrients didn’t (and won’t) go anywhere. By the same token, there’s no reason not to apply after two years based on estimated removal using the same P and K rates set to be applied a year ago. Unless a cover crop has been or will be harvested from a prevented-planting field this fall, removal will be zero.
Our most recent numbers to use for estimating P and K removal (see my Bulletin article with details) are 0.37 lb P2O5 and 0.24 lb K2O per bushel of corn and 0.75 lb P2O5 and 1.17 lb K2O per bushel of soybean.
We mentioned last spring the concern about the “fallow syndrome” that’s been associated with having no crop in a field for an entire growing season. This problem, which appears as a phosphorus deficiency, has been more commonly seen in fields or parts of fields where water has stood for much of the season; it was reported in the Mississippi River bottomlands in 1994 following the flood of 1993, when water stood on parts of fields through much of the summer. If weeds or cover crops grew on prevented-planting fields for most of this summer, especially in August and September, the crop-friendly fungi (VA mycorrhizae, or VAM) that prevent this problem likely are still present, and there’s no cause for concern.
In low-lying spots where water stood into mid-summer, and in fields kept weed-free through the summer by tillage or herbicide, we can’t rule out a possible problem due to loss of VAM. There are commercial preparations of VAM that can be applied in-furrow to inoculate corn next spring. In most cases, it will be enough to make sure there’s adequate P close the seed so the crop can take it up as growth begin, after which VAM will start to regrow in the roots of the new crop. Growing a cover crop this fall will restart VAM growth this fall, and should rule out the need for any additional steps next spring.
A year without a crop is used deliberately in some dry regions to store water for the next crop, but is a novelty for most Illinois fields. So we don’t have much research to help predict what this might mean for the next crop: is “fallow” in 2019 more like soybean or more like corn in its effect on the 2020 crop? We think the answer is “neither” – that 2019 will instead be an “amnesty” year, in which any effects of the 2018 crop got canceled or at least minimized, leaving open the choice of crop in 2020. Wheat planted this fall can be expected to do well on fields where neither corn nor soybean grew in 2019, as long as we get rid of plants that can serve as a reservoir of insect-vectored diseases (see Nathan Kleczewski’s Bulletin article on this), take care not to plant too early, and provide enough P for the crop.
The extent to which weeds or cover crops grew and matured might influence how having no crop this year might affect next year’s crop. Any addition to the weed seed supply could complicate weed control going forward. Large quantities of mature (high-carbon, low nitrogen) residue produced this year may act much like corn crop residue, increasing the N requirement for a 2020 corn crop. Because weed or cover crop growth requires soil water, there may be a little less stored soil water next spring in fields where there was a lot of growth this year. But most fields that didn’t grow a crop this year are likely to have more water stored in the soil now, and should also have more mineralized N, both because less N was taken up by a crop, and because there is less residue whose breakdown ties up N. These increases may well diminish by next spring, but they still might be helpful to next year’s crop, whether that’s corn or soybean. In using the N rate calculator to set corn N rates in fields with no crop and minimal weed or cover crop growth this year, I suggest choosing soybean as the previous crop; in fact, with no removal of mineralized N from the soil by soybean this year, it might be appropriate to also set N rates for next year’s corn crop a little lower (within the MRTN range) than usual. In fields with a lot of residue present now, it might be more appropriate to select “corn” as the previous crop when using the calculator.
Fertilizer application
Soils are currently dry enough to allow application of dry fertilizer materials over much of Illinois; the wettest part of the state is northwestern Illinois, where the crop still has to mature. Harvest started slowly in Illinois, but with the warm weather this week, it will accelerate quickly as long as it stays dry. The development of wet conditions could slow both harvest and fertilizer application that follows harvest, but soils in the drier parts of Illinois can take in an inch or two of rainfall without turning muddy or forcing much delay. Most people are anxious to start applying fertilizer after the delays and frustration in getting this done over the past year.
There has been a considerable amount of discussion about whether or not placing P fertilizer beneath the soil surface is a sound practice. The main reason for doing this is to keep the P in MAP or DAP, which is highly soluble, from dissolving and running down slopes and into streams in the event of heavy rain. How much of this might occur is affected by slope, permeability of the surface soil, how dry the soil is, how much crop residue is present, and the intensity of rainfall. Soils following soybean harvest are generally more permeable than following corn harvest, but corn leaves more residue. Tillage increases surface permeability, but also loosens soil to make it move more readily with runoff water. Drier soils can take in more water before runoff begins than can wet soils.
October and November are drier months, on average, than spring months, crops growing into the fall extract a significant amount of water from the soil thus leaving it drier, and high-intensity rainfall events are less likely in the fall. So overall, chances of getting high-loss conditions are lower in the fall than in the spring, but they aren’t zero. Surface-applied P will move into the soil under normal weather conditions, and will end up safe from direct loss (it can still move if soil runs off the field) by December. Most research has shown no yield benefit to subsurface P and K placement in the fall, and it is not clear that the added cost of subsurface placement will provide a positive return in most years and on most fields. In strip-till systems, however, where subsurface placement doesn’t add to the amount of surface soil disturbance, applying P and K beneath the strip while strip-tilling in the fall may be a cost-effective way to apply these nutrients.
Although we’ve found that the N in DAP tends to be available to the next year’s crop if DAP is applied after soils cool down to 50 degrees, applying MAP or DAP when soils are warm will allow much of the ammonium from these materials to convert to nitrate in the fall; once it’s nitrate it can move down with water into and through the soil, including to tile lines if there’s a lot of rainfall. Even if the N doesn’t move too far down in the soil in the fall before the soil freezes, it will have a head start when water begins to move through the soil in the spring. There can also be direct movement of ammonium (along with P) in surface runoff during heavy rainfall before the MAP or DAP has had a chance to dissolve and move into the soil.
While it may not be practical to hold off on applying MAP or DAP until soil temperatures fall to below 50 degrees, we should recognize that even though the amount of N in these fertilizers is relatively small, it can add appreciably to the N that moves to surface waters through drainage tile. One solution that has been suggested is to switch from using MAP/DAP as the P source to using triple-super-phosphate (TSP, 0-46-0) which contains no N. If TSP is available at about the same cost per pound of P as MAP or DAP, it would be a good source to use, especially for applications made before mid-October. The “free” N that comes with MAP or DAP is more likely to reach tile lines than the roots of next year’s corn crop if it’s applied when soils are warm in the fall. If it’s applied after soil temperatures reach 50 degrees or if it’s applied next spring, the N in MAP or DAP does contribute to the N supply for next year’s crop.
Soil temperatures and fall ammonia application
Written by Emerson Nafziger, University of Illinois (View the U of I bulletin)
According to NASS, Illinois producers harvested 36 percent of the corn crop and 52 percent of the soybean crop by October 20. That’s still behind the average pace of harvest, but harvest continues in many areas this week, and as it progresses, fields in many areas are becoming available for fall field work to begin.
Many producers in central and northern Illinois have fall anhydrous ammonia application high on their to-do list, especially after the fall of 2018 and the spring of 2019, when getting any nitrogen fertilizer applied was a challenge. As we have seen before, most people were able to work around the weather issues to get N applied, in some cases by changing to in-season applications, and sometimes changing the N form to one easier to apply in the narrow windows of opportunity last spring. While we hope not to see a repeat of such challenges very soon or very often, this past year reminds us that retailers and producers are up to the challenge of getting N applied even when the weather doesn’t cooperate.
Timing of anhydrous ammonia application in the fall is a major issue, and there is a considerable amount of anxiety related to having to wait until soil temperatures are low enough for safe application. Ammonia and ammonium-containing N fertilizers are the only fertilizer materials that are safer from loss when applied to cool soils than to warm soils. This is because the soil contains large populations of nitrifying bacteria that convert ammonium ions to nitrate ions—this process is called nitrification. As a cation, ammonium ions are attracted to the negative charges on clay and organic matter surfaces; this attraction means that ammonium ions don’t move with water as it moves downward through the soil. As an anion (negatively charged ion), nitrate is not attracted to negative charges in the soil, and so can move downward with water.
Nitrifying bacteria extract energy from ammonium while converting it to nitrite and then to nitrate; in the process, three oxygen atoms are added and hydrogen atoms and water are released. Because this is a biological process, nitrification is sensitive to temperature. The bacteria operate (and multiply) fastest at temperatures in the low to mid-80s, and the cooler it is the lower their activity; the rate of nitrification is close to zero at 40°, and is only about one-fourth of maximum at 50°. This means that waiting until soil temperatures are 50° or less will mean slow nitrification, and once soil temperatures reach 40°, almost all ammonia applied (which converts quickly to ammonium) will remain in the ammonium form—and so safe from loss—until soil temperatures rise.
Since the conversion of ammonium to nitrate stops only at soil temperatures of 40 degrees or less, should we need to wait until soil temperatures are 40° before we apply ammonia in the fall? We probably would if we could, but soil temperatures in central Illinois don’t reach 40 until after mid-November, which in practical terms means that the opportunity to apply ammonia in the fall would be greatly restricted. Another reason is that anhydrous ammonia released into the soil acts as a powerful sterilizing agent: it spreads out into the soil as it changes from a liquid to a gas at the knife, and kills most living things in the soil into which it moves. This means that microbes need to grow back into the depleted application band, and that takes enough time at cool soil temperatures to allow the soil to cool even more before there are enough bacteria to get nitrification back on track.
Another method available to slow nitrification is the use of a nitrification inhibitor. The most common one in use over the past decades is nitrapyrin, which has been in use for more than four decades. The most common trade name for this chemical is N-Serve®, but nitrapyrin is also sold under other names. Centuro®, with the active ingredient pronitidine, is a relatively new nitrification inhibitor from Koch Agronomic Services. These act to decrease the activity of nitrifying bacteria, either by killing the bacteria or by chemically inhibiting their ability to convert ammonium to nitrate. These inhibitors break down in warm soil, and so they are effective for a longer time when applied in cool soils.
Using inhibitors with fall ammonia provides an extra measure of protection in the event soil temperatures rise (as they sometimes do) shortly after application, and when soil temperatures begin to rise in the spring. They do not “lock in” N to keep it perfectly safe from nitrification and movement; in fact, if soil temperatures drop to 40 degrees soon after application and stay down until spring, a nitrification inhibitor may not be necessary. We can’t know what will happen from fall until the next spring, though, so using a nitrification inhibitor provides insurance against unexpected increases in soil temperatures followed by wet weather that can move nitrate in the soil.
Our recommendation for fall ammonia application in Illinois is to wait until soil temperatures are below 50 degrees, and also to use a nitrification inhibitor. The most pressing question for most people is how to know for certain when soil temperature is low enough, and also to have an idea of whether soil will stay cool and cool down some more to help protect the N after application. Like air temperatures, soil temperatures change over the course of the day, so soil temperature is a moving target. Figure 1 shows how soil temperature changed over 24 hours on October 23, 2009. Low soil temperatures typically occur at about sunup, and the high temperatures at about sundown. The average soil temperature recorded for this date was 48.5, which is close to the value recorded at noon. So if we take a soil temperature at a particular time, noon will best represent the value for that day. Even so, the soil was above 50° for about 10 hours of the day, during which time nitrification would have proceeded.

Figure 1. Soil temperature (bare soil, 4” depth) at Peoria on October 23, 2019. Data are from https://www.isws.illinois.edu/warm
While these numbers show that higher rainfall during the spring is associated with the need for more N, the fact that the numbers in 2014 and 2018 don’t follow this trend indicates that this is complicated. For one thing, when it rains might be as important as how much it rains: April and May rainfall were at or below normal in 2014 and most other years (2017 was an exception), while June rainfall was well above normal in 2014, 2015 and, except in western Illinois, in 2018—all years with more responses to higher amounts of N. Yield levels were also higher in 2018 than in other years, which likely increased N demand. Because June rainfall isn’t very predictable at the beginning of June, we will probably need to wait into at least the middle of this month to assess the need for more N based on rainfall amounts.

Figure 2. Daily minimum, maximum, and average soil temperature averaged over six years (2013-2018) at Peoria. Data are from https://www.isws.illinois.edu/warm
Because we often have access to more information on air temperature than on soil temperature, it helps if we can predict soil temperature from air temperature. Figure 3 shows the daily average air and soil (bare, 4” depth) temperatures over the past six years at the Illinois State Water Survey WARM site (located at Illinois Central College) at Peoria. While these lines are close together when averaged across years, how air temperature changes in a given year can be quite different compared to how soil temperatures change. So while soil temperatures generally follow the drop in air temperatures in October and November, it’s helpful to follow air temperature trends, but to also track soil temperatures after mid-October each year in order to know when soils are cool enough.

Figure 3. Air and soil temperature (bare soil, 4” depth) at Peoria, averaged over 6 years, 2013-2018. Data are from https://www.isws.illinois.edu/warm
So, will we be ready to begin applying anhydrous ammonia in central Illinois soon? So far this October, soil temperatures at Peoria have, with some ups and down, trended cooler than over the past six years (Figure 4). Even more encouraging, the forecast is for below-normal temperatures to arrive this weekend, at to last into the beginning of November. We can’t know if they’ll rise after that, but if they drop to the mid- or lower 40s by early November, the N we apply should be as safe as we can make it. There’s no special need to rush—the wet weather we had a year ago doesn’t look likely to return soon—but in terms of soil temperatures, there’s no reason why application can’t start during this last week of October.

Figure 4. Average daily bare-soil (4” depth) temperatures at Peoria from 2013 through 2018, and so far in 2019. Data are from https://www.isws.illinois.edu/warm
There are a few basics to follow when applying anhydrous ammonia in the fall. Fall ammonia applications should include a nitrification inhibitor. Ammonia should not be applied in the fall south of IL Route 16 (which roughly follows the Shelbyville moraine) because soils there stay warm longer and warm up more quickly in the spring, increasing the chances of loss. Don’t apply fall ammonia on very heavy (clay) soils due to increased chances of N loss from denitrification next spring, or on light-textured soils (sandy loam or lighter) due to increased chances of leaching loss. The N rate calculator, which we will update with new data this winter, indicates that N rates of about 180 in central Illinois and about 160 in northern Illinois are appropriate. If you plan to apply N in any form—MAP or DAP this fall or next spring; planter-applied N next spring, or N solution as herbicide carrier—be sure to adjust the amount of N this fall by applying only the amount needed to produce the total for next year’s crop.
While some in the northern Corn Belt have begun to apply urea in the fall, we do not believe that this is a safe practice in Illinois. Even when urea is protected by polymer coating to slow its release or by inhibitors to slow the conversion of the ammonium that forms as urea breaks down in the soil, the N from urea usually ends up at shallow depths in the soil, and so is vulnerable to nitrification if surface soil temperatures rise. Urea also provides none of the sterilizing effect that ammonia release in the soil provides, and this means that nitrifying bacteria can go to work on the N from urea without delay. It's certainly possible that most of the N from fall-applied urea can carry over to be available in the spring, but that means that everything has to go just right. Under Illinois conditions, the chances of that happening are too low to make this a safe way to apply N.
Managing Nitrogen for Corn in 2020
Written by Emerson Nafziger, University of Illinois (View the U of I bulletin)
As was the case a year ago, there have been limited opportunities to apply nitrogen fertilizer since last fall. Rainfall in Illinois through the first three weeks of March has been at or above average, and temperatures have been a few degrees above normal. Soils remain wet, and there is little in the current weather pattern to indicate that a drying period is on its way soon. Potential drying rates will increase as temperatures rise, though, and we will hope that rainfall remains at or below normal to allow soils to dry as we move into April.
N rate
Despite difficult conditions in 2019, Dan Schaefer of the IFCA and John Pike in southern Illinois, with funding from the Illinois Nutrient Research & Education Council (NREC), were able to conduct on-farm N rate trials that showed that responses in most regions, even with late planting, were similar to those found in recent years. Yields were generally not as high as in 2018, but in central and northern Illinois, the fact that responses were similar to those already in the database meant that adding the data from the 2019 trials didn’t change the guideline N rates (MRTN values) by very much for this part of the state.
The 2019 data in southern Illinois, however, continued the trend we saw in 2017 and 2018, in which higher yields required higher N rates to reach those yields. Such a correlation between optimum N rate and yield across trials does not exist in higher organic-matter soils in central and northern Illinois. We think this is because weather conditions (warm temperatures and plentiful moisture) that lead to high yields (and high N uptake) also increase the amount of N supplied by mineralization of soil organic matter, leaving the amount to be supplied by fertilizer unchanged, at least on average. In contrast, soils in southern Illinois have less organic nitrogen to mineralize, so high yield levels there make the crop more dependent on N from fertilizer.
This correlation between N rate and yield in southern Illinois supports the idea that we consider adding more fertilizer N to corn growing in lower organic-matter (<2% OM) soils in southern Illinois if the crop has high yield potential. I suggest using the MRTN rate for yields up to 190-200 bushels per acre, and for yield potentials above that (determined based on crop condition when corn is 2 to 4 ft tall), use a total of 1 lb of N for each bushel of expected yield. That may often mean applying N with high-clearance equipment, either as broadcast urea or as UAN dribbled near the row. Dribbled N often distributes more uniformly, and leaving UAN on the surface near the row moves it closer to the root system and may improve uptake.
Use the N rate calculator to calculate best (MRTN) N rates for corn in Illinois. We updated the database in early March, adding the 2019 data and removing some of the older data. Using a corn price of $3.50 per bushel and the current ammonia price of about $500 per ton ($0.30 per lb of N) produces the MRTN values and ranges shown on Table 1 below. Low and high ends of the range are those N rates at which the return to N ($ per acre) are $1.00 less than at the MRTN. MRTN values are also shown for N prices of $0.40 and $0.50 per lb, keeping the corn price at $3.50 per bushel. N prices for UAN and urea are currently around $0.43 per lb of N.
Remember that the MRTN rate (and ranges) generated by the N rate calculator includes all of the N applied to the field, not just to the main application. This means counting into the total any N applied with MAP or DAP in late fall or spring, any N applied with herbicide or with the planter. If N from several different sources is used, base the rate of the last application (adding in all previous amounts) on the price of fertilizer N that is used for the last N application.
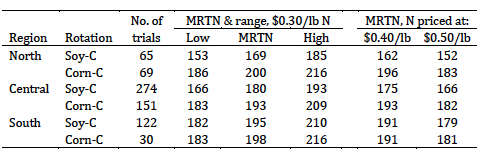
Table 1. Current MRTN (guideline N rates) for corn in Illinois, after adding the data from the 2019 growing season.
N timing
In about 90 percent of on-farm trials comparing N rates applied as ammonia in both the fall (with N-Serve) and the spring, fall- and spring-applied N have produced virtually identical responses to N rate, at the same yield levels. Across 16 trials, including several in which spring-applied N performed better, and several in which fall-applied N performed a little better, the optimum N rate averaged about 12 lb higher—181 versus 169 lb/acre—and the yield at the optimum N rate 1 bushel less—235 versus 236 bushels per acre—for fall-applied N compared to spring-applied N. That meant an advantage of $9 per acre in return to N for spring-applied N, but since getting that added return would have required knowing when and by how much to decrease N rates for spring-applied N, it would have been difficult to realize this benefit. The average optimum N rate for fall-applied N was almost identical to the MRTN for central Illinois (Table 1): using the MRTN would meant using more than the optimum N rate in more of the spring-applied N trials, and so would have meant less advantage for spring-applied N across these trials.
One of the main lessons we’ve learned from our N timing and N form studies in recent years is that, in order to maximize yield potential, corn plants need to have a substantial amount of N available in the soil near the row after plants emerge and before their nodal (main) root system starts to develop. In one study in 2019, the crop was planted in late April but fertilizer rates couldn’t be applied until early June due to wet May weather. As a result, N responses rose in a straight line up to the maximum N rate used (250 lb of N), and did not reach a maximum. We also saw several instances in which cover crop rye was not controlled early, and probably because the rye roots had stripped the N from the upper soil, corn yield suffered even when high rates of N were applied after the crop emerged.
We don’t know exactly how much N needs to be present during early corn growth, but we believe that this N needs to be in the soil near the plants when the nodal roots begin to appear—at about growth stage V2. To have 40 to 50 ppm available N in the upper soil at V2 means incorporating 40-50 lb N in the top 3.5 inches of soil, and having most of the N stay there. If we incorporate N into a zone 7.5 inches wide by 3.5 inches deep centered on the row, only 10 to 12 lb N per acre will produce 40 to 50 ppm, if the N uniformly distributed and if it stays there for at least 3 weeks (300 GDD) after planting. That amount (but not much more than that) could be applied in-furrow, but any downward movement of that N would take it out of the rooting zone of small plants. Applying 30 to 50 lb N in a 2 x 2 placement, or dropping liquid or dry fertilizer over the row to provide 30 or 40 lb of N per acre would better assure having N when it’s needed early, if there’s equipment to do that. In-furrow placement of 10-12 lb of N as UAN is better than nothing. Seedling damage from such applications is rare, but split-tube placement with a seed firmer will protect a little better against this.
Even if planting is delayed and takes precedence over N application, some N really does need to be applied into or atop the row before the crop emerges: it is too risky to wait for several weeks to get the first N applied, especially if even that N is not placed near the row. If it stays wet this spring, some producers and retailers might need to get creative in order to get this done. Delayed planting means warmer soils at planting, and warmer soils mean more mineralization. This will boost the soil N supply some, but especially if rain moves some of the mineralized N down, there may still not be enough to maximize yield potential of the crop.
Splitting N
In one set of results from different forms and times of application of 150 lb N per acre, we found that a split with 100 lb at planting and 50 lb applied in-season generally yielded a little more than applying all of the N between the rows at planting. Applying 50 lb N as broadcast UAN at planting (to mimic the use of UAN as herbicide carrier at or after planting) then 100 lb as UAN injected at stage V5 did not yield as well, probably because there wasn’t enough N near the root system when it was needed, before sidedress. Most of the treatments with 100 lb N injected at planting followed by 50 lb as sidedressing worked about equally well. Waiting until sidedress time to apply all of the N was not an effective way to apply N, and placing UAN on the soil surface also produced lower yields, even when urease inhibitor was included. All of these point to the importance of having enough N in the soil early enough to maximize yield potential during early growth, and of applying all of the N in a way that results in less loss.
We also found in these studies that splitting N—with some at or before planting and the rest as sidedress—often produces yields no higher than applying the same rate (with appropriate placement) early. That does not mean we shouldn’t split-apply N, but we should do it more for logistical purposes than as a way to get higher yields with the same (or lower) rate of N, at least on productive soils. We have found no advantage to keeping back 50 lb N to dribble in-row at tassel, nor have we found an advantage to applying N several time (spoon-feeding) during the season. Very wet June weather, such as we had in 2015, in some cases meant a response to adding additional N. But getting N applied under such conditions is not easy, and every trip to apply N brings the added cost of application as well as the risk of not having the N get to the roots for uptake in time for the plant to respond.
Inhibitors
Despite the fact that inhibitors sold as N fertilizer additives have been around for decades, there remains a considerable amount of confusion about these products, including what they do, and when and how they should be used. Nitrification inhibitors slow the activity of bacteria in the soil that convert ammonium to nitrate. Both ammonium and nitrate can be taken up by plants, but the ammonium form is attracted to negative charges on clay and organic matter, and so stays in the soil, while nitrate is negatively charged, so moves readily with water as it moves down through the soil. So slowing the conversion of ammonium to nitrate (nitrification) is a way to keep more N in the soil and available to the crop under high-loss (wet) conditions. Chemicals sold as nitrification inhibitors include nitrapyrin (products include N-Serve® and Instinct II® by Corteva); pronitridine, a newer product developed and sold as Centuro® by Koch Ag; and dicyandiamide (DCD), a nitrification inhibitor sold by a number of companies under different trade names.
We normally add a nitrification inhibitor with anhydrous ammonia applied in the fall. The later we apply ammonia in the spring the less likely it is that a nitrification inhibitor will be needed to protect the N. As a biological process, nitrification is slow when soil temperatures are in the 50s (through early-, mid- and late April in southern, central, and northern Illinois), and begins to speed up once soil temperatures reach 60 and above, which usually occurs in late April in southern Illinois and mid-May in northern Illinois. If we add in the effect of the NH3 itself in suppressing microbial activity, it’s unlikely that applications of ammonia made after mid-April in southern Illinois or after early April in northern Illinois will need the further delay in nitrification provided by nitrification inhibitor. There are exceptions to this: May can be warm and wet, with rapid conversion to nitrate, in which case a nitrification inhibitor can be helpful. But if the crop is planted early and grows fast in May, uptake starts early as well. And if the weather is relatively dry, N is unlikely to move in the soil even if it’s all nitrate. This makes it difficult to know at the time of application whether we should add a nitrification inhibitor, and we should play the odds based on current conditions and expected planting time to help make this decision.
Because cool soils are slow to dry, early spring (preplant) applications of ammonia are usually done when soils are wetter than ideal. Ammonia application on wet soils means more soil compaction, and with the diameter of the ammonia band very small when application is into wet soil, its concentration in the band is high. If the soil dries out considerably after application (a rarity if it’s wet into April), NH3 can begin to leave the band where it’s been dissolved and to move up in the soil through the knife track, where it could damage seeds or roots. Using RTK to apply the band 6 to 8 inches away from where the row will be planted can eliminate such damage. Tilling after ammonia application can also help disperse the band and will usually lower or eliminate the risk of ammonia injury on seedlings. Deeper placement can also help prevent damage, but will leave the N farther from the roots.
The other type of inhibitor sold for adding to N fertilizer is urease inhibitor. Inhibitors that do this include NBPT (sold under different brand names), and mixtures of NBPT with duromide (ANVOL® from Koch Ag) and with NPPT (Limus® from BASF). Thiosulfate, which is also used as a sulfur source, is thought by some to inhibit urease, although lab studies tend to show that it’s less effective. As the name implies, urease inhibitors are effective only when added to urea or to other urea-containing fertilizers such as UAN solution. They do not slow the conversion from ammonium to nitrate; they only slow the breakdown of urea into ammonia and carbon dioxide. If this breakdown happens on or near the soil surface, ammonia can go off as ammonia gas into the air.
Ammonia is extremely soluble in water, so if urea breaks down in moist soil, the ammonia released will dissolve immediately, and hardly any of it will escape into the air. The urease enzyme that speeds up this breakdown is very common in soils, so if urea or UAN is broadcast on the soil and there is no rain for a week or more, a lot of ammonia can be lost into the air. Broadcast UAN, because it spreads the N in a thin layer over the soil surface, exposes more of the urea to urease activity. But only half the N in UAN is in the urea form—the other half is nitrate and ammonium, which aren’t affected by urease. UAN does contains some free ammonia in solution, and some of this may volatilize as the solution dries. Dry urea, once it dissolves in soil water, is all subject to urease, but urea granules that fall into cracks in the soil surface may gain some protection.
Rainfall moves urea into the soil and also wets the soil and dissolves ammonia, greatly decreasing the loss of ammonia. This means uncertainty regarding whether or not to use urease inhibitors. If urea or UAN is incorporated into the soil at or soon after planting or at sidedress time, there is no need to add a urease inhibitor, since ammonia rarely escapes from soil. Dribbling or surfacebanding UAN exposes it a little less to urease and moves some into the soil a short distance. UAN dribbled on the surface near the row is a little less exposed to sunlight and wind, and water coming down the plant stems from light rain or dew can help move the N into the soil. Still, surface-applied UAN can never be considered completely safe from volatilization loss, so an inhibitor might be useful if the forecast is for warm conditions without rain for a week or more after surface-banding near the row.
With warm surface soil temperatures, nitrification will begin soon after the urea is dissolved and in the soil (as ammonium). SuperU® (from Koch), which has both urease and nitrification inhibitors, has performed well in trials when broadcast on the surface, and has yielded more than broadcast urea with the urease inhibitor Agrotain (NBPT). Assuming that both products inhibited urease equally, the difference must have been due to more rapid conversion of ammonium to nitrate, and movement of some of the N out of the rooting zone.
Novel products sold to increase microbial N fixation
There has been a recent upswing in advertising and products that are said to provide the microbes or to stimulate existing soil microbes that fix atmospheric nitrogen and make it available to the corn crop. Microbial N fixation is the way that soybeans get most of the N they need, but such fixation in legumes involves the pant producing nodules that are attached to the roots below the soil surface, and in which anaerobic (low-oxygen) conditions exist to aid in the fixation process. We’ve known for a long time that there are some “free-living” (not in nodules) bacteria in soils that can fix N for the atmosphere, but measured fixation rates by such microbes tend to be very low – on the order of a few pounds of N per acre. That’s in part because fixing atmospheric N requires a great deal of energy, and a soybean plant can pump sugars into nodules a lot faster than sugars leak out of (corn) roots to feed this process in microbes that live near the roots. There was once hope that corn plants could be genetically modified to produce nodules and house bacteria that could fix much of their own N, but the machinery the plant needs to form nodules and to transport fixed N in the plant is so complex that this seems to be unlikely, or at least a long ways off.
There are two types of these products, mostly developed and marketed by startup companies backed by venture capital. One type is a preparation of the microbes (bacteria) that fix N; these are usually applied in-furrow, with the idea that they’ll multiply and grow near the root to eventually get enough sugars from the roots to fix N that the plant can take up. The idea is that corn plants and such bacteria form a mutually beneficial (symbiotic) relationship, with the corn providing sugars and other growth substances and the bacteria giving back N. It’s not entirely clear that bacteria can act as little “N pumps” like this, and if they can, it’s not clear how such a symbiosis would benefit either the plant or the microbe.
The other type of product being marketed is a chemical product that is said to stimulate the growth and function of bacteria that go on to fix N for the corn plant. It appears that some of these can be applied as foliar sprays, presumably with the idea that they can be released by the roots into the soil, or that they stimulate the plant to release something on its own that in turn stimulates growth of bacteria that fix N.
Claims on websites for these products might say that they make the plant (and roots) grow faster, and often show photos to that effect. Some mention how much N fixation might be expected from using the product. I have not done any work with any of these, but will just observe that pinning down rates of N fixation by microbes when rates are low (25 lb N per acre per season seems to be a somewhat typical amount) is really difficult, and any such numbers should be viewed with caution. One way that some such studies have been done in the past is to use a relatively high rate (say 200 lb N per acre) and then a lower rate, say 160 or 175 lb N per acre, along with the product, and if the yields are about the same, to conclude that product provided the difference.
I’d suggest a wait-and-see approach to products like this. Some companies are asking producers to conduct on-farm trials, and if it’s possible to do a set of paired strips, assigning with and without treatments randomly within each pair, that might provide some information. Split-field trials are a lot less satisfactory, since the two halves of a field never yield exactly the same, and field variability is likely to be greater than any treatment effect. But most companies will control the data from such trials, and in most cases products “win” when such results are put up on websites.
Managing N this spring
One lesson we learned from the 2019 growing season is that we can get nitrogen applied even when conditions are not very good. That doesn’t mean that N was used to its best advantage in every field: there were examples of fields where N was not applied early enough to maximize yield. But with proper attention to applying the right rate at the right time, using a form that will protect against loss, Illinois farmers have the ability and flexibility to get N management done right, even when spring conditions are challenging.
While it’s wet over most of Illinois now, and the weather forecast doesn’t look very promising that it will turn warm and start to dry very soon, we can begin to plan our N management strategy based on principles discussed above. Instead of developing elaborate scenarios of what might happen this spring and how to respond, I’ll list here a number of things to keep in mind as we go forward:
- Use the N rate calculator as the start to determining how much N to apply. Note the “profitable range” that extends on either side of the MRTN. For most fields the total N rate should be within this range, and results of hundreds of trials over the years in Illinois tell us that we can expect the return to N (increase in yield and gross income minus N cost) to be maximized at the MRTN.
- While we have said in the past that we might consider moving N rates out of (above) the range given by the calculator, we have found a consistent advantage to doing only when it’s been very wet in June. Root damage from too much soil water and/or loss of N may in such cases mean that the crop can benefit from additional N, but only soils dry some to improve root function, and if N can be applied by or before the time of pollination.
- In southern Illinois, apply rates within the MRTN range, and wait until V5 or V6 to decide whether yield potential is above 190 to 200 bushels per acre; if it is, consider adding some N later in vegetative growth to bring the total rate up to 1 lb N for each bushel of expected yield.
- Rainfall from last October 1 through March 23 has ranged from a little below normal to normal in the northern half of Illinois, and from 3 to 6 inches above normal in the southern half of the state. There were a few spikes in temperature and rainfall over the winter, but we don’t think that more fall-applied N has been lost than usual; we can count on its being present for the 2020 crop.
- If we get a break in the weather that allows ammonia to be applied before late April, we should consider taking advantage of that. Ammonia is currently cheaper, and is safer to apply, than any other form of N. We should take care to avoid applying it in such a way that planter units can drop into the application band, but otherwise the chances for seedling damage from ammonia are low.
- If wet soils delay both planting and the application of N, it will pay to find a way to get some N (at least 40 to 50 lb N per acre; more may be better if it’s not concentrated close to the row) applied so that it is available to the nodal roots as they start to develop at about stage V2.
- If cereal rye is present in fields where corn will be planted, try to spray it to kill it several weeks before planting. The large the rye is when killed, the more critical it is to kill it early. If the rye makes substantial (more than 8 inches) of growth before it’s killed, pay additional attention to getting N close to the row at planting in order to replenish when the rye removed from the soil.
- If you plant corn where there was no crop in 2019 and where weeds were controlled by tillage or herbicide, the 2020 crop might benefit from planter-applied phosphorus in order to prevent “fallow syndrome.” If there’s a flush of spring weed growth, or if MAP or DAP is broadcast this spring, there will be les™s (or no) need for placing P close to the row.
Is Fall a Good Time to Apply Nitrogen?
Written by Emerson Nafziger, University of Illinois (View the U of I bulletin)
Applying anhydrous ammonia in the fall to provide N to the corn crop the following year has a long history in Illinois and in other parts of the Corn Belt where rotation, tillage, and manure management practices allow it. Fall application means getting a major field operation done when soil conditions are generally more favorable than they are in the spring, and it helps to spread the work load across more months. Historically, the cost of ammonia has also been lower in the fall than in the following spring, which has provided an extra incentive for fall application.
Although fall application remains a common practice in Illinois, it has come under increasing scrutiny in recent decades. Fall application means having N in the soil about six months before the crop will begin to take it up, and soil conditions during these months are not predictable. Ammonia converts to ammonium in the soil after application, and as long as soil temperatures remain low, the microbial conversion of ammonium to nitrate is slow. Once N is in the nitrate form, however, it can move downward with water moving though the soil, and, in tile-drained fields, can leave the soil and move into surface water. Fall-applied ammonia usually has a nitrification inhibitor added to slow this conversion process, but if soils warm up and there’s substantial rainfall by May, some of the ammonium will convert to nitrate, and some this nitrate may be lost. Spikes in river and surface water nitrate usually come in the spring, and while much of this N is from residual left after the previous fall’s harvest, fall-applied N undoubtedly contributes some to this.
As we might expect, the amount of fall-applied N that is lost (moved out of the field, denitrified, or moved below the rooting zone) before plants can take it up varies widely over years and soils. Measured and modeled estimates of loss show this variability, but as long as guidelines are followed, we do not believe that losses reach the high levels that some models have shown. These guidelines include: 1) no fall application on light or very heavy-textured soil; 2) no application at soil temperatures above 50 degrees; and 3) no fall application in regions without cold winters, including southern Illinois. There can of course be loss of spring-applied N as well, especially if N fertilizer used in the spring contains nitrate (for example, UAN) which can move in the soil without delay. Surface-applied, urea-based N sources can also volatilize (lose N as ammonia gas), dissolve and run off the field with heavy rain, or convert to nitrate rapidly when soil temperatures are warm; such N can be lost to downward movement or to denitrification if water stands in the field.
The best way to measure the actual effect of fall versus spring N application is to compare timings in side-by-side N rate strips in field trials. We are fortunate in Illinois to have a set of such trials, managed by Dan Schaefer of IFCA and conducted, with funding support from the fertilizer tonnage fee through the Illinois Nutrient Research & Education Council, in farm fields from 2014 through 2018. To our considerable surprise, we found that in nearly every case, corn responded to N rate almost the same for fall-applied as for spring-applied N. Figure 1 below shows N responses in one of these trials in which both the optimum N rate and the yield at the optimum N rate were slightly higher for fall-applied N.

Figure 1. Comparison of fall- versus spring-applied ammonia in an on-farm N rate trial in 2018.
The results found in fifteen other trials were similar to those shown in Figure 1. Most of these trials were with corn following soybeans, and most were in central Illinois. Averaged over these 16 trials, the optimum N rate, using a corn price of $3.75/bushel and an N cost of $0.30/lb ($492 per ton of ammonia) was 186 lb N per acre with fall-applied ammonia and 176 lb N per acre with spring-applied ammonia. The yield at the optimum N rate averaged 235 bushels per acre for fall-applied N and 236 bushels per acre for spring-applied N. We can also use these responses to calculate a “return to N” (bushels added by N × corn price minus N rate × N price); the RTN averaged across these 16 sites was $406 per acre for fall-applied N and $414 per acre for spring-applied N.
We elected to drop one trial from this set of data due to its unusual response. This trial was in the river bottoms near the bluff, and it’s possible that the lighter-textured soil there received extra water that moved off the bluff. At that site in 2017, it took 193 lb of N as fall-applied ammonia to produce 227 bushels, while it took only 125 lb of N as spring-applied ammonia to produce 245 bushels. There was a considerable amount of variability in the trial, and using the MRTN rate of 180 lb N/acre for both would have produced yields only 12 bushels higher for spring-applied N. But this does show that when conditions for N loss are high, fall-applied N losses can be substantial. At the same time, these results show that the crop has nearly the same access to fall-applied N as to spring-applied N, and that applying N in the fall is not as economically or environmentally problematic as some have suggested.
So why not continue to apply N in the fall, or even move more application to the fall? In some areas this option has become limited by the fact that some fertilizer dealers no longer offer anhydrous ammonia, but instead offer other forms, typically UAN solution. Reasons for this often include safety—anhydrous ammonia is more hazardous to transport and apply than other forms of N. Ammonia needs to be injected into the soil, and this requires toolbars, large tractors, and labor when harvest and tillage may still be underway. Soil conditions also need to be dry enough, but not too dry, to allow application and proper sealing. Wet fall weather, the need to wait until about November 1 for soils to be cool enough for safe application, then having a short window to apply before soils freeze are all factors that have acted to nudge N application towards spring. We have found, in recent years when fall application has been limited, that moving a lot of N application to the spring is possible with existing equipment. Although this pushes a lot of extra work into the spring months, dealers and producers have been creative in finding ways to make application and very wet spring weather and late planting, producers managed to get N applied on the crop that got planted.
Despite its limitations, anhydrous ammonia typically remains the lowest-cost source per unit of N, although application costs and safety concerns may decrease that advantage some. More importantly, ammonia is the form of N most likely to stay in the soil and remain available to the plant. Uniformity of application has improved with development of better equipment, and at 82% N, using ammonia means transporting less weight. As I’ve written many times before, there needs to be some N fertilizer applied near the row at or very soon after planting; UAN is probably a better source than ammonia to place N in this way. A nitrogen management program that includes perhaps a third of the N as preplant or planting-time UAN, then the rest as sidedressed ammonia, may be worth considering.
Going into the fall, the main challenge with ammonia application is to wait until soil temperatures are low enough to keep the nitrification process to a minimum. In a typical fall that means waiting until the end of October. While going a few days early may not seem like a big deal, remember that soil microbial activity doesn’t stop completely until temperatures near freezing, and with soil temperatures continuing to fluctuate, soils will usually spend some time at temperatures above 50 even if they’re at or below 50 on the day of application.
Soil temperatures and fall ammonia application
Written by Emerson Nafziger, University of Illinois (View the U of I bulletin)
As we indicated in a recent Bulletin article, nitrogen applied as anhydrous ammonia in the fall is an effective source of N for the corn crop, but is also a little more subject to loss compared to N applied in the spring. One of the main factors that determines how much of the fall-applied N is subject to loss is how much of the ammonia converts to nitrate (is nitrified) in the fall and early spring, before the next planting season.
One way to slow nitrification of fall-applied ammonia (which converts quickly to ammonium in the soil) is to add a nitrification inhibitor. The other way is to wait to apply ammonia until soil temperatures are low enough to limit the activity of the bacteria responsible for the conversion to nitrate. Scientists have studied the effect of soil temperature on nitrification rates for decades. Most of this work has been done on soil brought indoors and kept at different temperatures, then adding ammonium and measuring the amount of nitrate that forms over time.
Estimating how quickly ammonium is converted to nitrate in the soil turns out to be complicated, but like most biological processes, it takes temperatures close to freezing to stop the nitrification process completely. Adding the ammonium as anhydrous ammonia also increases the pH and kills a large number of bacteria, effectively delaying the start of nitrification by days or weeks, with longer delays when soil temperatures are lower. Once nitrification begins, soil temperatures in the upper 70s produce maximum rates of nitrification; rates drop to about 50 percent of maximum at 60 degrees, to 10 percent of maximum at 50 degrees, and to about 5 percent of maximum at 40 degrees.
Because nitrification still takes place (slowly) at 50 degrees, why don't we wait until soil temperature is less than this-say 45 or 40 degrees-before starting to apply ammonia? Waiting until 50 degrees to apply ammonia is a compromise that produces some opportunity to apply at all in falls when harvest is delayed, soils are wet, or soils freeze early. It takes advantage of the delay in nitrification caused by ammonia itself, and of the fact that soil temperatures continue, at least on average, to drop over time. On the other hand, soil temperatures typically rise and fall unpredictably during the fall, and a rise in soil temperature both shortens the delay in the start of nitrification and speeds up the breakdown of nitrification inhibitors.
Managing the risk of having substantial nitrification following application means taking into account both current and predicted soil temperatures when deciding when to apply fall nitrogen. Because soil temperatures fluctuate during the day and are different at different depths, we also need to decide when and at what depth to measure soil temperature. How much the soil temperatures fluctuates during the day depends on soil texture and color, soil moisture, air temperature, and the amount of sunshine. We don't want to use either maximum or minimum, so often take soil temperature at 1 O AM and 4 inches deep under bare soil as an estimate of daily average conditions in the ammonia band after application. Drier soils tend to limit nitrification some, and they also warm and cool more quickly as air temperature changes.
As an example of the challenge of waiting until soil temperature are low enough and likely to stay low, soil temperatures (at 10 AM at a depth of 4 inches under bare soil) averaged over sites in central and northern Illinois as reported by the Illinois Climate Network from October 1 through 25, 2020, are shown in Figure 1 below.

Figure 1. Soil temperatures at 4 inches deep under bare soil, averaged over eight central and four northern Illinois sites from October 1 through October 25, 2020. Data are from the Illinois State Water Survey at https:llwww.isws.illinois.edu/warmlsoil/.
As an exercise, let's say that we applied 150 lb N as ammonia on the first day that soil temperatures were below 50 degrees (October 5). Let's further assume that it took 7 days before nitrification kicked in, that the maximum rate of nitrification at high soil temperatures is 10% of the amount applied (15 lb N) per day, and that the nitrification rate rises steadily, from 5% of maximum at 40 degrees to 50% of maximum at 60 degrees. Under these assumptions, 18 lb N per acre in central Illinois and 15 lb N per acre in northern Illinois would have been nitrified by October 25. That might not seem like a lot, but it is in the range of what we measure as tile line nitrate loss following fall (compared to spring) application, and even if temperatures are normal over the next six weeks, more nitrification will take place. With the lag period already over, early application of fall N also means that the nitrification process is primed and ready to go whenever soil temperatures allow.
The good news is that air temperatures have averaged a few degrees below normal in October, and the forecast is that they will remain somewhat below normal this week. Soil temperatures follow air temperatures, of course, and at this point we expect that soil temperatures will drop a little more this week, and that the drop will continue into November. This puts us into the same position we were in late October 2019, when I reported that starting ammonia application at the beginning of the last week of October would not pose an undue risk of nitrification.
We know from records that soil temperatures can rise into the 40s and even into the 50s during the winter, so waiting until soils are cool before applying ammonia doesn't rule out further nitrification. The fact that periods of heavy rainfall before soils are frozen or after they thaw can result in spikes in surface water nitrates tells us that some nitrification always takes place between fall and spring. Some nitrate that moves from fields is that present in the soil at crop maturity, either from unused fertilizer or N mineralized from soil organic matter after plant uptake stops. But some also comes from fallapplied N; we can minimize this by careful management, and can largely eliminate it by moving application to the spring.
Keep in mind that managing N to minimize loss starts with choosing the best rate. In Illinois that is the MRTN rate, found by using the calculator at http://cnrc.agron.iastate.edu/. It is best to keep some N back to apply in the spring, both to provide flexibility (if prices change) and also to make sure that what is applied in the spring is included in the N rate. If the amount to be applied in the spring is already known-for example, if 45 lb N will go on between herbicide carrier (UAN) and through the planter-then use the expected price for next year's corn crop and the current price of ammonia in the calculator. At a corn price of $4.00 per bushel and ammonia at $475 per ton ($0.29 per lb N), the MRTN rates are 184 and 191 lb N per acre for corn following soybean in northern and central Illinois, respectively, and 216 and 21 O lb N per acre for corn following corn. Besides subtracting the amount to be applied in the spring, subtract also the N applied as MAP or DAP, if those were applied after October 15. If MAP or DAP was applied in September or early October, the N is by now mostly in nitrate form, and the amount subtracted can be decreased by perhaps a third to account for likely loss of some of this.
References:
Nafziger, E. "Is Fall a Good Time to Apply Nitrogen?" Department of Crop Sciences, University of Illinois, September 30, 2020. https://farmdoc.illinois.edu/field-crop-production/is-fall-a-good-time-to-applynitrogen.html
Nafziger, E. "Soil temperatures and fall ammonia application." Department of Crop Sciences, University of Illinois at Urbana-Champaign, October 25, 2019. https://farmdoc.illinois.edu/field-cropproduction/uncategorized/soil-temperatures-and-fall-ammonia-application.html
Adjusting Nitrogen Fertilizer Rates to Price Changes
Written by Emerson Nafziger, University of Illinois (View the U of I bulletin)
Corn planting progress continues, with 23% of the Illinois crop planted by April 25, and planting continues with some rain delays the last week of April. The warm temperatures that finally arrived will be good for emergence of both corn and soybeans, but there are some reports of damage to early-planted soybeans from frost on April 21 and 22.
Warmer soil temperatures will start the mineralization process by which microbes release N from soil organic matter, although with soil temperatures only in the 50s now, this will process will remain slow. Warm rain will help raise soil temperatures and provide water to help move this process along as the crop emerges and gets established. Nitrogen from starter fertilizer or from broadcast UAN will help as well.
A great deal of nitrogen fertilizer has been applied, helped along by having soils fit to apply N while producers wait for it to warm up enough to improve planting conditions. We can’t rule out some loss of N from surface-applied UAN due to urea hydrolysis as surface soils have stayed dry, but cool temperatures have slowed this process.
Because the N rate calculator that we use to set N rates is sensitive to corn and N fertilizer prices, many are wondering if rate decisions made last fall or early this spring should be revisited. Those who still need to make the last application of N needn’t revisit this, since the total rate is set by the last application of the season, and prices at the time of that application should be used to set the rate. All N fertilizer applied before the last application is sunk cost that can’t be changed.
The MRTN—the N rate predicted from previous N rate trials to be the amount needed to maximize profit from N fertilizer—changes considerably when the price of either corn (per bushel) or N (per pound of actual N) changes while the other doesn’t. But if the price of both change in the same direction and the ratio between the two doesn’t change, the MRTN doesn’t change. Both corn and N prices have risen in recent months, raising the question of how much change in N rates we should make for this year’s crop.
Let’s use the N rate calculator to look at how N rates responded to price changes since last fall. Setting last fall’s anhydrous ammonia price at $500 per ton and corn at $4.00, the MRTN for corn following soybean was 185 lb N/acre in northern Illinois and 192 lb N/acre in central Illinois. With current prices of $700 per ton for anhydrous ammonia and corn for fall delivery at $5.25, MRTN values are 181 lb N/acre in northern Illinois, 189 lb N/acre in central Illinois, and 209 lb N/acre in southern Illinois. These are pounds of N: multiply these numbers by 1.22 to give pounds of ammonia. Because the ratio of N price to corn price changed little, rates barely budged. If you have different prices to use, enter them into the calculator to find the MRTN. Corn following corn will have higher MRTN values.
Anhydrous ammonia is typically the lowest-priced N fertilizer, so produces the highest MRTN value if we keep the corn price fixed. As an example, using UAN 28 at $300 per ton and keeping corn at $5.25 per bushel produces MRTN rates that are 10 to 12 lb N/acre lower than those given above for anhydrous ammonia.
The MRTN rate is the total amount of N to apply, and it’s important to include all N applied prior to fixing the rate for the last application. That includes any N from MAP or DAP applied last fall or this spring, any N applied with the planter or as broadcast UAN used to apply herbicide, and any manure. Do not make a subtraction for corn following soybean, since the calculator already makes that adjustment. We don’t have evidence that having a legume cover crop (like hairy vetch or clover) before corn produces enough N or that the N becomes available to the corn crop early enough to cut fertilizer N rates. A grass cover crop like cereal rye or annual ryegrass might lower N availability, but if it’s killed a few weeks before planting it’s probably safe to use the MRTN rate without adjustment. If rye has made more growth before it is killed, moving to the upper end of the MRTN range provided by the calculator might be appropriate.
Does it really make sense to change N rates just because fertilizer or corn prices change, or when we change from a lower-cost to a higher-cost (per pound of N) fertilizer material? It helps that ammonia, which is the lowest-cost form, is also the best at staying in the soil after application compared to forms (like UAN) that contain some nitrate; urea is in-between. We also find that fertilizer N and corn prices tend to move in the same direction, as they have in recent months, although one usually begins to move (as the corn price did last fall) before the other does. This means that the N:corn price ratio is less volatile than the price of either N fertilizer or corn; as a result, the MRTN N rate doesn’t fluctuate greatly, at least once prices equilibrate.
The default setting in the N rate calculator is with prices that result in a ratio of 1:10—this ratio was chosen because the ratio really does tend to move towards 1:10. At that ratio, the last bushel of yield produced as N rate increases pays for 10 pounds of N; if that bushel can only pay for 5 pounds of N, we lose money. Although the weather can throw us a curve, we can depend on our productive Illinois soils to provide the rest of the N the crop needs for high yields.
We’ll continue to watch the crop and weather to see if any surprises come up, but relatively cool and dry soil conditions so far in 2021 has meant little N movement in soils. If we get normal rainfall and temperatures in May, there is little danger of having N move below the rooting depth by the time N uptake begins to accelerate in late May. Having mineralization kick in while N movement remains low will help set the corn crop up for a good start.
Mid-June Notes on the 2021 Corn Crop
Written by Emerson Nafziger, University of Illinois (View the U of I bulletin)
The 2021 corn crop was planted ahead of normal, although “normal” includes the very late planting in 2019 and late planting in 2020, so “typical” might better describe 2021 planting progress. There were no extended wet periods in April or May, but wide swings in temperatures affected emergence and early growth. Crop ratings are about average for mid-June, but have slipped some, probably due to dry conditions in some regions. June temperatures have been favorable for crop growth, and sunlight amounts have been good.
Concerns about dryness continue, with most of Illinois north of I-80 currently designated as abnormally dry or in moderate or severe drought, worsening as we move from the Quad Cities to the northeast corner of Illinois. There are some small pockets of abnormally dry conditions elsewhere, but about 80% of Illinois is designated as free of drought. June rainfall has been below normal over most of Illinois, though, and as crop demand for water increases, a change to more widespread rainfall would be welcome.
High crop prices have heightened expectations, but have also brought pressure to maximize yield, despite weather uncertainties in some regions. Following are some observations regarding this year’s corn crop, as we consider in-season management and take lessons from this year’s experiences.
Crop progress
Stands are good to very good in most fields, and warmer temperatures have increased growth rates and improved uniformity in plant size. Parts of April and May were cool, but growing degree day accumulations were close to average in April, a little below average in May, and above average during the first half of June. From April 1 through June 15, GDD accumulations range from about 900 (100 above normal) in northern Illinois, 950 (near-normal) in central Illinois, and 1050 (50 below normal) in southern Illinois. Totals are about 200 to 250 GDD lower that this for May 1-planted corn. Nearly all of the Illinois corn crop has entered its most rapid growth and nutrient-uptake phase that begins at about stage V8. Canopies are closing rapidly as leaf area expands, and we expect sunlight interception to reach 90% by the time plants are at stage V12, or about chest-high. Getting there by the longest day of the year helps boost yield potential by increasing kernel set during pollination.
If the next month brings average temperatures, corn planted in early April should begin to pollinate the last few days in June, and corn planted around May 1 should begin to pollinate the second week of July. Below-normal rainfall in most regions recently has stimulated root growth due to good soil aeration and receding soil moisture. Less cloudiness has meant good sunlight amounts, so high photosynthetic and growth rates. Increasing crop demand for water as canopies fill out will become a problem if rains don’t return, at least in drier areas and on lighter soils. As long as leaves remain flat and not curled up during the day, growth is continuing. Smaller corn plants with smaller root systems often show curling that begins earlier in the day, but such stress has less effect than on larger plants. Leaf curling in larger plants may be accompanied by shorter internodes due to lack of water for cell expansion. As long as the water supply returns to near normal by a week or ten days before pollination, kernel set and yield potential should be good.
Nutrients
Nitrogen: Temperature fluctuations after emergence caused canopy color to fluctuate in May before improving under warm conditions in June. Night temperatures in the 30s or low 40s cause loss of chlorophyll and paler leaves; it takes several days of warmer temperatures to regenerate chlorophyll and for photosynthetic and growth rates to return to normal. The amount of N available to the nodal roots as they emerge can affect how quickly plants recover, and starter fertilizer might have helped such recovery this year. Warmer soils also help, both by causing roots to grow faster and by increasing the rate of mineralization to provide N to the roots. With the warm soils and little movement of N as soils remain relatively dry, both crop growth and crop canopy color have recovered well in most fields. Depending on planting date, soil type, and N fertilizer practices, many fields are taking on the dark green color that signals a plentiful supply of N.
Good canopy color reflects both improved crop growing conditions and lack of saturated soils that can compromise roots and result in N loss. The 2016 season began much like this current one, and that season was marked by good yields and by below-normal need for high N rates. Over 34 on-farm trials in corn following soybean in 2016, the average optimum N rate was only 157 lb/acre, which produced an average yield of 225 bushel per acre. The MRTN rate in place in 2016 was 175 lb/acre in central Illinois, and about 75% of the trials needed less N than that. The MRTN rate has risen with addition of responses from recent years, and there is no reason to think that the 2021 crop is going to need more N than the current MRTN rate of 175 to 200 lb N per acre (N rate calculator). When the canopy has good color during the second half of June following application of N rates in this range, there is little chance that adding “insurance” N will increase yield, and even less chance that it will increase profit. N uptake slows after pollination, and with N in the soil and more being released by mineralization, chances of developing N deficiency more or less disappear once ear formation begins, although dry soils during grainfill can limit N uptake and so can cause deficiency regardless of how much N is in the soil.
Phosphorus: Purpling of plants that is often associated with phosphorus deficiency was fairly common earlier this year, especially on hybrids genetically prone to showing this. Purple color develops when sugars produced by photosynthesis are unable to move out of the leaves quickly enough, and their buildup leads to the formation of purple pigment. A major “sink” for sugars is roots, which grow and function slowly in cold or dry soil, causing sugars to accumulate. Low plant P content can slow sugar movement out of leaves, so can also contribute to a buildup of sugars. The good news is that this condition goes away quickly once the cause of sugar buildup diminishes—which usually means once soils warm up and soil moisture is restored—with no lasting effect on the crop.
Potassium: We haven’t heard many reports to date, but dry soils that limit root development can limit K uptake, and if soils stay dry we might begin to see K deficiency symptoms. Roots need to grow out into the soil volume in order to take up K, which moves very slowly towards the root on its own. So when roots have difficulty growing out into the soil during the time of most rapid K uptake (from stage V8 to V15), K deficiency symptoms can occur even when soil test K levels are high. This is more common with no-till, typically when roots have difficulty growing out of the planting furrow and into the soil between the rows when soils are dry. Rainfall relieves such symptoms quickly.
Sulfur: Sulfur deficiency has somewhat unexpectedly appeared in some fields this year, even in deeper prairie soils where we seldom see such symptoms. Lower-lying areas with higher soil organic matter may show not symptoms, while plants in higher parts with slightly lower OM may show paler green color that identifies S deficiency. The major function of both N and S in the plant are as components of proteins, and deficiency symptoms can look similar. S-deficient plants may show interveinal striping (lighter and darker green alternating on the newer/upper leaves), and S is less mobile in the plant than N, so lower leaves in plants with S deficiency tend to stay relatively darker green than those with N deficiency. Mineralization mobilizes both N and S from organic matter, and so we seldom expect to see S deficiency under conditions like those that prevail now. Cool soils in May might have limited the mineralization process, and since more fields get some N with early fertilizer than get S, more fields might be showing S deficiency.
Should S be applied if the crop is showing deficiency? This is a difficult question, but if symptoms are mild and not clearly identified as being due to S deficiency (applying some S is the only way to know for certain), it may be better to wait for another week to see if the symptoms disappear. If symptoms are clear and are strongly suspected of coming from lack of S, then applying S may be appropriate. Elemental S will become available to the plant too slowly to correct a deficiency, and foliar forms are less common. The best option is probably to dribble ammonium thiosulfate solution (12-0-0-26S) at perhaps 5 gallons per acre (14.5 lb S) near the row.
Cover crop
Corn following a cereal rye cover crop has become more common, and this has brought increased management challenges. Cereal rye works well as a way to take up N from the soil following last fall’s harvest, thereby keeping it from reaching tile drainage water. But we need to learn how to make this work without lowering corn yields. The aggressive growth that makes cereal rye good at taking up N also makes it an aggressive grass weed in corn, and only by making sure rye is dead before corn is planted can we minimize the chances of corn yield loss. In a spring with dry conditions like those in some areas this year, water taken up by the rye can directly limit the amount available to the corn seeds, which can affect uniformity of emergence and corn plant growth, even when rye was killed before corn was planted. But the biggest danger comes from having rye roots active in the soil during corn crop establishment. This creates competition for water and for N, and the corn plant seldom wins such a competition. This year we have heard of cases of tilling rye rather than killing it with herbicide; planting ”green” without killing the rye before corn planting; and mowing off rye plants, killed at or after planting, after corn emerges. All of these can be expected to decrease water and N available to the corn crop, and some may also lead to allelopathy—damage to corn plants from substances released as residue breaks down. Adding more N now won’t fix problems like these once the corn is damaged, but we can take a lesson for next time.
Other inputs
Dry weather has meant relatively little foliar disease development in corn, although that could change if the weather pattern changes. While low disease usually limits response to foliar fungicides, there seems to be increasing emphasis on using foliar (strobilurin) fungicides as “stress relievers” for crops. There is some physiological basis for this: some strobilurins decrease plant respiration rates for a while after application, and although plants need to respire, a temporary decrease in respiration can increase the amount of sugar available for plant growth during critical periods. This may theoretically provide more of a boost for C3 plants like soybeans and wheat than for corn, which is C4. But such are marketed as a way to diminish the effect of “stress” on corn, including stress due to things such as leaf loss as well as drought. This issue is complicated by timing and severity of drought and other stressors, and with little research data available, the conclusion is that fungicides work most consistently as fungicides and not as stress-relievers.
It’s too late to apply most other novel products such as microbes that might be sold as a way to increase root growth and thereby help the crop when it’s under moisture stress. Some of these are now being promoted for application with post-emergence herbicides, presumably as a way to lower cost, but possibly also because this makes it difficult to leave strips without the additive, since all strips need herbicide. If other products are out this year, we hope they are in strips to allow evaluation of both visual and yield effects.
When spray planes fly over corn fields, insecticides are often in the spray tank, not because there are insects known to be threatening the crop, but because including them is inexpensive and application is “free.” One certainty is that such applications will kill beneficial insects—those that help control actual crop pests. In this way, insecticides without a target can actually worsen, rather than relieve, damage form insects.
Canopy-Watching
Today’s hybrids have a remarkable ability to develop and maintain a complete, dark-green canopy, which in turns results in high kernel number (per acre, not per plant) and high yield potential. Although water-gathering ability of hybrids is also very good, inadequate water remains the largest threat to the corn crop, as long as other factors such as pests are not limiting. With a full canopy, the Illinois corn crop has a daily water requirement similar to the estimated potential evapotranspiration (PET) that is calculated daily at various weather-recording sites. This number can be as high as a quarter to three-tenths of an inch in mid-summer, and totals of 6 to 7 inches for the month of July are typical. If the crop needs 6 inches and 4 inches of rain falls during the month, the soil needs to supply the other 2 inches in order to maintain yield. If only 2 inches of rain fall and the soil is unable to provide the other 4 inches, then the crop will spend days or afternoons unable to take up water, which limits photosynthesis and yield. How much of this happens on a daily basis, compared to having the canopy active all day long, is a good measure of how yields will end up. The corn crop fills grain for roughly 40 days once it gets past the lag phase, and that means that a good crop needs to add an average of 5 to 6 bushels per day, and more than that on sunny, warm days to make up for those days that are cloudy.
Wet Soils and Corn
Written by Emerson Nafziger, University of Illinois (View the U of I bulletin)
The 2021 cropping season in Illinois (and the Corn Belt) continues to be a story of haves, have-nots, and have-way-too-much with regard to rainfall. In the first three weeks of June, nearly all of Illinois had below-normal rainfall, and concerns about dryness increased. That ended abruptly: in the three weeks from June 25 through July 14, rainfall totals ranged from below normal in the northwestern counties to 25 to 75% above normal in southern Illinois to 100 to more than 200% above normal in central Illinois, with some parts of western Illinois (and scattered areas elsewhere) getting more than 10 inches of rain during that period.
Crop condition ratings responded accordingly, with good + excellent ratings of 80% for corn and 77% for soybean on May 30 dropping, by July 11, to only 60% for corn and 56% for soybean. Such drops from high to mediocre during the first half of the season are unusual: this happened during the drought of 2012, but it’s more common for ratings to start low and move up than the other way around, and drops in ratings tend to come from dry weather during mid-season. The 2011 season showed a trend like 2021, and for a similar reason—a major rainfall event in the last week of June while the crop was growing rapidly.
The real concern from ponding and saturated soils during mid- to late vegetative development is the health of roots. Root system development was stimulated by dry soil conditions, demonstrated by the fact that corn showed good growth and nutrient uptake despite dry conditions in June. With good conditions for mineralization, good soil aeration, and minimal downward movement of soil N resulting from moderate or low rainfall, plants took up N well: canopy color in most fields was good to excellent by mid-June. In N rate studies, corn in plots without any N fertilizer developed good leaf color as well, and N deficiency appeared in these plots later than it normally does.
The first few inches of rain that fell the last week of June helped replenish soil water supplies, and were welcomed. But when inches kept accumulating, soils became saturated and water began to accumulate in low part of fields. Roots of fast-growing crops quickly use up the oxygen in saturated soils, and oxygen movement into saturated soil is very slow. Carbon dioxide given off by the roots and by soil microbes also accumulates, and is toxic to roots. Roots in saturated soils soon stop taking up nutrients, and plants begin to turn yellow as N deficiency intensifies. Larger plants have more N already in the plants, and this slows the development of deficiency.
In one of our studies located in Drummer silty clay loam soil at South Farms, corn planted on April 26 was at stage V13 (about head-high) with outstanding canopy color, when the rain began on June 25. Between June 25 and July 1, a little more than 4 inches of rain fell, which was enough to cause water to stand for a few days in the lower-lying part of the field where the trial was located. [The trial was located there because growth was better in early June due to the better water supply.] Soils were still very wet on July 7, when the photo shown below (Figure 1) was taken. Note that brace roots that had developed on the lower 2 aerial nodes appeared to be dead; mud on them shows that they had been submerged. A new ring of brace roots can be seen elongating at the node above. Plants were tasseling by then, and leaf color remained fairly good.
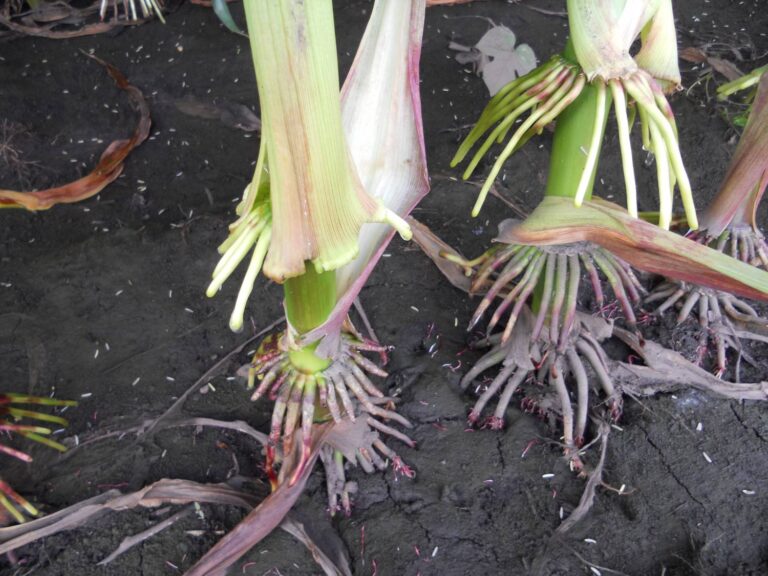
Figure 1. Brace roots on plants in wet soils on July 7, several days after flooding.
While having brace roots emerge at higher nodes to replace damaged ones seems encouraging, the new brace roots shown in Figure 1 had not reached the soil, so were not yet able to help with nutrient or water uptake. Producing new brace roots takes energy, in the form of sugars in the lower stalk. That sugars were available for brace root initiation and growth may indicate that the main root system was not using sugars as fast as normal, leaving more available. Brace root growth pattern is a hybrid trait to some extent, but excessive brace root growth is often an indication that something has gone wrong, leaving too much sugar in the lower stalk. When this happens close to pollination, it’s possible that more sugar in the plant could be helpful to kernel set. But roots produce some plant hormones and their health affects the plant in other ways, so while extra brace roots show that the plant is still photosynthesizing to produce sugars, we can’t take it as a positive.
We were fortunate to miss most of the inches of rain that fell in other parts of Illinois during the first two weeks in July. Although the soil was still wet, root systems in the low part of the field had revived to some extent by July 14, with at least some of the initial brace roots (which a week earlier appeared to be dead) having branched out and to send smaller roots into the soil (Figure 2). The new brace roots had continued to elongate, but most of them had not yet reached the soil surface. Pollination was nearly complete, as indicated by the dry anthers on the ground. Lower leaves were no longer green, having lost most of their N and begun to die off.
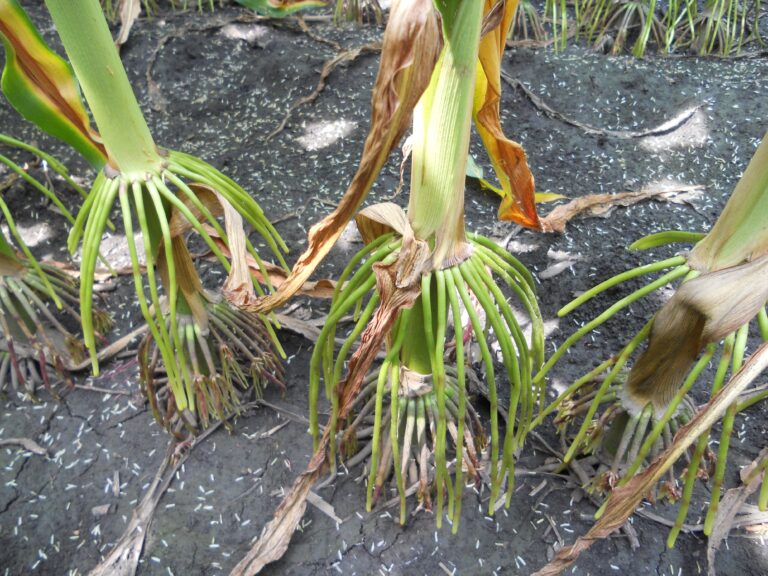
Figure 1. Brace roots on plants in wet soils on July 7, several days after flooding.
A plant similar to those shown in Figure 2 was pulled and its roots washed off to show the distribution and state of the root system (Figure 3). Although original (thick) roots growing down and away from the base of the stem appear to be dead past a few inches from the stalk, roots originating from the brace roots have formed a new root system, including some roots that had reached 6 to 8 inches deep in the soil. A few of the new ring of brace roots had also entered the soil, and others were poised to do that soon.
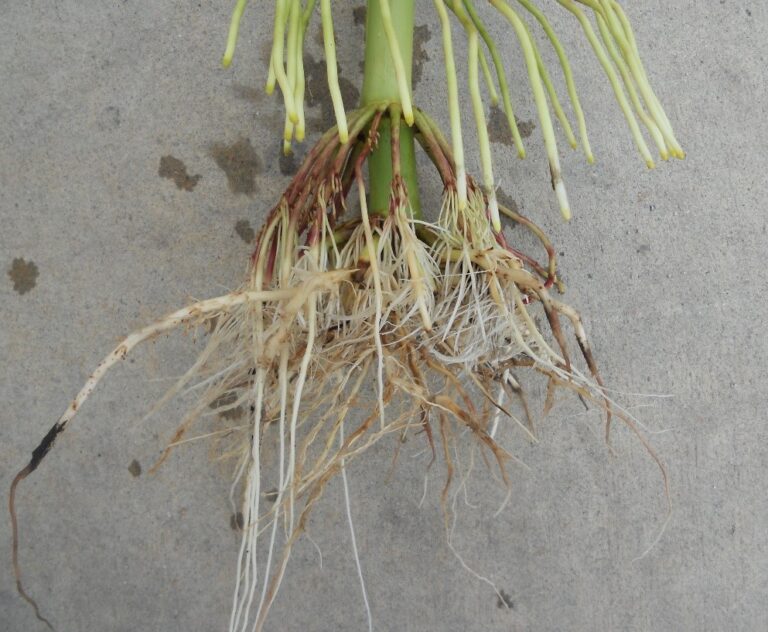
Figure 3. Root system on a plant similar to those shown in Figure 2.
It is certainly beneficial that the plants had survived and that they appeared, at least above-ground, to be relatively healthy. Leaves in the center of the stalk, around the ear, still had good color. It appears that kernel set should be close to normal in these plants. The uppermost few leaves aren’t as dark green, though—Figure 4 shows the contrast between middle and upper leaves. But whether or not the problems caused by wet soils have been alleviated by root regrowth will depend heavily on what happens during the next six weeks. The forecast for the third week of July is for limited rainfall, which will help the new root systems to grow more and perhaps to take up the N needed to restore or maintain green leaf color. If dryness extends over a longer period, though, the root system may not be able to provide the water needed—up to a quarter inch per day—to maintain the high rates of photosynthesis needed over the next six weeks to keep and fill kernels. And, if a lot of rain falls again, the new roots may suffer anew.
Figure 4. Upper canopy on corn plants growing in wet soils.
Maintaining high photosynthetic rates will require plant nutrient uptake: roughly one-fourth of the N, one-third of the P, and one-sixth of the K remain to be taken up between the end of pollination and maturity. Water coming into the plant will bring some N with it, although with N likely depleted by denitrification in saturated soils, this may need to come mostly from mineralization, which may not start up as quickly as needed. Non-mobile nutrients like P and K could be more difficult for a diminished root system to reach. Whatever the case, keeping photosynthetic rates high with a diminished root system will be a challenge.
This example used here, of plants with root damage but potential for good yields, lies somewhere in the middle of a damage/potential scale, between plants that stood in water for a week or more or are still standing in water, most of which are dead or dying, and plants that were in wet soils but that did not stand in water. With warm temperatures and rapid plant growth during late vegetative stages, corn roots typically stay alive in standing water for no more than a few days. Where water never stood, plants may be in good shape still, although soil saturation in areas with high rainfall over many days may have had their root systems compromised to some extent.
The real measure of how things are underground will be how well canopy color holds up through August. We are optimistic, but getting to good yields will take a lot of cooperation from the weather.