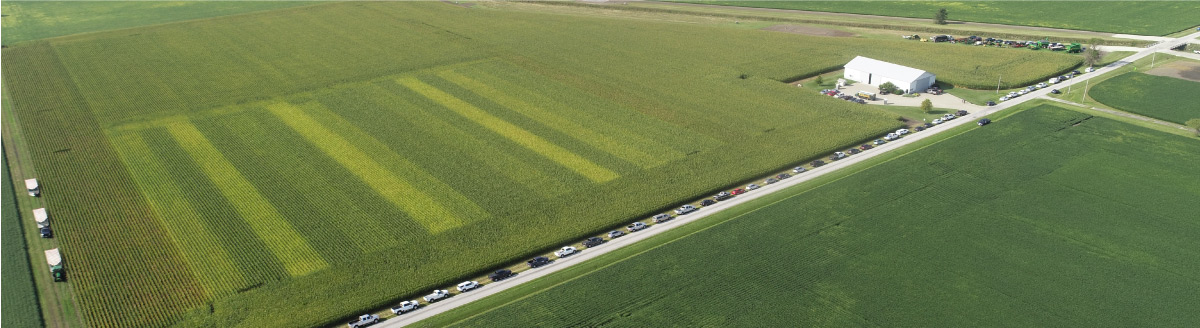
Hundreds of full-rate N trials like the one shown in the photo above have been used to develop the N rate calculator that generates Maximum Return to Nitrogen (MRTN) N rates using current corn and N fertilizer prices. Whether we use N rates in the MRTN range or amounts higher than that, canopy color almost never tells us whether that the amount of N was less than, about equal to, or more than the crop needed in that field, that year. A corn crop with 50 or 60 pounds more N than it needs looks just like one with less N, so those who use high rates have no way to know that the extra N did not pay for itself. Nitrogen deficiency symptoms rarely appear in productive soils unless the soil stays wet for a period of time, in which case symptoms are worse in lower-lying parts of the field.
We are initiating a program that we think will help improve the MRTN approach, by telling us how much, if any, yield we gain by using higher N rates, or lose by using more modest N rates. Where possible, we hope to use aerial imagery (drones) to monitor canopy color development and match it to yield differences. In fields where the higher N rate produces more yield, we hope to be able to use information from these comparisons to learn how to predict when that will happen, and to use more N in such fields.
Here's the plan for doing trials like this in the field:
- Each trial will have only two rates: One is the N rate already planned for the field, counting all sources of N: MAP/DAP, pre-plant N, N applied with herbicide, and sidedressed N. We’ll call this the field N rate (FNR). If the FRN is around the MRTN rate (180 lb N or less in central and northern Illinois and 200 lb N or less in southern Illinois for corn following soybean; 210 lb N or less for corn following corn), the comparison N rate (CNR) will be 50-60 lb more than the FNR. If the FNR is 225 lb N or more, the CNR will be 50-60 lb less than the FNR.
- The CNR is applied in a single strip through the field at a chosen location in the field, well away from the edges of the field. A second strip can be placed in another part of a large field, or the comparison can be done in several different fields.
- The CNR strip should be wide enough to allow yield data to be collected from two combine harvest passes, with each pass compared to a harvest pass at the FNR next to (on each side of) the CNR strip. For example, if the N applicator covers 40 ft. and the corn head is 8 rows (20 ft.) wide, one applicator pass is enough, although two passes might be better. Mark both sides of the CNR strip with flags, and with GPS if possible.
- Yields from the four passes (two at the CNR and two at the FNR) will be taken using a combine yield monitor, with each harvest pass labeled as a separate load if possible.
Please click below to fill out a field form to participate. Our goal is to have these comparisons in every county in Illinois. If you have any questions, please contact Dan Schaefer, dan@ifca.com (217-202-5173). If you are south of I-70, please contact John Pike, jpike1.ag@gmail.com (618-727-1234).